Intern Ultrasound of the Month: Pericardial Effusion and Cardiac Tamponade in COVID-19 Pericarditis
The Case
40-year-old male with no prior cardiovascular/pulmonary history presented to the ED with 2 weeks of progressive chest pain. He described the pain as substernal, non-radiating, pleuritic in nature, positional, and was interfering with his sleep. He had never had this pain before and denied any personal or family cardiac history. He also reported associated fever and shortness of breath. Denied any recent cough, sputum production, abdominal pain, or trauma or injury to the chest wall. He was unvaccinated against COVID-19.
In the ED, he was found to be febrile to 39.3, tachycardic to 110, normotensive, and O2 saturation was 98% on room air. He had no focal findings on exam.
EKG showed sinus tachycardia, diffuse ST elevation with depression in aVR, PR depression in II and PR elevation in aVR, suggestive of pericarditis. POCUS was then utilized at patient bedside.


POCUS findings:
LV noted to have a normal global ejection fraction
No evidence of RV enlargement
Moderate-large circumferential pericardial effusion with associated:
Right atrial systolic collapse
Slight RV diastolic collapse (but only seen on subxiphoid view)
Increased mitral inflow velocity
Plethoric IVC with minimal respiratory variation
Overall impression: Findings concerning for developing tamponade
Case continued: Labs were notable for leukocytosis and elevated CRP. COVID-19 PCR test was positive. Initial troponin was negative. The patient’s presenting symptoms and EKG findings were suggestive of acute pericarditis. As he was hemodynamically stable initially, there was less concern for clinical tamponade. However, given the sonographic findings concerning for developing tamponade, IV fluids were initiated to support preload. He had mild hypotension in the ED but never required vasopressors. Cardiology was consulted and the patient was admitted to telemetry for further evaluation. He was started on high-dose NSAIDs and colchicine with plan to repeat TTE 48 hours after presentation to reassess RV diastolic collapse, constriction, and pericardial effusion size.
Approximately 36 hours after admission, the patient was found to be tachycardic to the 150s, tachypneic, and febrile with worsening chest tightness and pain. Stat TTE was performed and redemonstrated a moderate to large circumferential pericardial effusion, plethoric IVC, mitral valve and tricuspid valve respiratory variations, and right atrial collapse. Due to patient instability and sonographic tamponade physiology on TTE, the patient underwent pericardiocentesis in which 600 cc of serosanguineous pericardial fluid was drained. The patient stabilized following the procedure, and the final diagnosis after pericardial studies resulted was COVID19-related pericarditis.
Cardiac Tamponade
Let’s Review!
Not all pericardial effusions cause tamponade. Remember - tamponade physiology depends on pressure, not the volume, of the pericardial effusion [1-2]. In the acute setting, as little as 150cc of fluid may be enough to cause tamponade because the pericardium doesn’t have time to stretch. Over time, however, the pericardium can stretch to accommodate a larger volume of fluid; therefore subacute to chronic fluids collections may be much larger before causing tamponade, if at all [3].
Fluid in the pericardial space —> increasing intrapericardial pressure (IPP) —> increased pressure on the right atrium —>impaired venous inflow into the heart.
Initially, an increase in IPP can be offset by increasing central venous pressure (CVP) (which is why our patient was administered fluid bolus in the ED). If, however, the intrapericardial pressures rise high enough, it becomes increasingly difficult to compensate by increasing CVP. Cardiac filling becomes impaired which leads to reduced cardiac output. In earlier stages of tamponade, the body attempts to compensate by increasing adrenergic tone. Eventually these compensatory mechanisms fail and cardiovascular collapse ensues. [1, 4]
While tamponade is often referred to as a clinical diagnosis, clinical signs and symptoms (such as JVD, Pulsus paradoxus, Kussmaul’s sign) have been found to be neither sensitive nor specific [5]. Dyspnea is the most common symptom but is nonspecific. Tachycardia is commonly seen though this may be suppressed by medications, which are commonly prescribed, or the presence of conduction system disease. Hypotension is often a late finding in tamponade, and particularly in subacute to chronic settings, patients may even be hypertensive [6].
Given the limitations of clinical assessment, POCUS is an invaluable bedside tool in the ED to evaluate for pericardial effusions and cardiac tamponade. POCUS has high sensitivity and specificity in detecting pericardial effusions [7] and allows for faster time to diagnosis [8]. Since tamponade is a continuum, rather than an all-or-nothing phenomenon, and sonographic findings often precede significant clinical findings, POCUS can prompt closer monitoring, earlier consultant engagement, and guide clinical management overall before a patient decompensates and requires emergent intervention.
POCUS Evaluation for Pericardial Effusion
Pericardial effusion [3]
Look for fluid in the pericardial space. This can be assessed in any of the cardiac views, and obtaining more than 1 view is important; if only seen in 1 view, it may not be a true effusion.
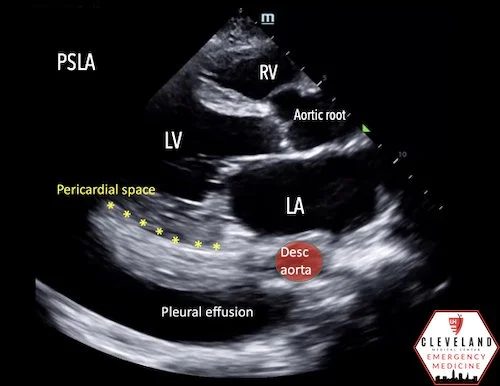
Differentiate from pleural effusion by looking at its relation to descending thoracic aorta in the parasternal long axis view (why it's important to have enough depth to visualize it)
A pericardial effusion is anterior to the aorta whereas a pleural effusion goes behind/deep to aorta.
Usually anechoic. But may be echogenic if clotted blood (or pus) is present.
Beware of a fat pad, which may mimic an effusion. Unlike an effusion, this moves with the heart and is usually only seen along the anterior border of the heart

Sonographic Findings of Tamponade [9-13]
1. Right Atrial Systolic Collapse
Earliest, most sensitive finding (absence of any diastolic collapse would argue against tamponade), but not specific. Commonly proceeds typical clinical signs [9]
Best views: apical four-chamber, subxiphoid
Tip: record a few cardiac cycles, then slow down the clip and replay (at normal speed it may be difficult to distinguish between systolic vs diastolic collapse, especially with tachycardia). Evaluate for RA collapse when AV valves are closed (systole)

2. Right Ventricle Diastolic Collapse
Most specific finding of tamponade [9]
Best views: parasternal long-axis, apical four-chamber, subxiphoid
Same tip applies – record and slow down the video. Evaluate for RV collapse when AV valves are open (diastole)
Our patient only had slight RV collapse seen in the subxiphoid. This may be somewhat related to angle of the probe, which is why it’s important to evaluate in more than one view.
An adjunct to visual assessment is M-mode. In a parasternal long axis view, place the bar through the anterior leaflet of mitral valve and RV. Hit M-mode button again to produce the tracing. Look for the E wave and A wave of the mitral valve tracing, which indicates mitral opening. If this correlates with a downward slope of the RV tracing, it indicates RV diastolic collapse and, thus, tamponade.

3.) Respirophasic Inflow Velocity Variation
Echographic equivalent of pulsus paradoxus
How to evaluate this:
Obtain an apical four-chamber view
Place pulse wave Doppler gate near the tip of the mitral or tricuspid valve leaflets on the ventricular side of the valve.
Variation can be easily visualized as peaks and troughs as the patient breaths.
Calculate variation between peak and lowest trough (corresponds to inflow during inspiration and expiration)
Abnormal variation (MV >25%, TV >40%) suggestive of tamponade.

Recap for our patient…
MV E Vel (exp): 78.75 cm/s
MV A Vel (insp): 53.80 cm/s
MV inflow respiratory variation: ~30% — this is a >25% change and was therefore concerning for ultrasonographic tamponade.

4.) Plethoric IVC with Minimal Respiratory Variation
Usually used as extra data point in patients for which you are borderline about tamponade
Distended IVC = high CVP = more likely to have tamponade
An IVC with respiratory-phasic changes (>50% collapse with deep breath) suggests a low CVP and rules out tamponade physiology with a 97% sensitivity [14].
In our case above you can see that the IVC is plethoric and there is minimal respiratory variation!
Take Home Points
Tamponade physiology occurs when pericardial pressure exceeds filling pressures in cardiac chambers
Rate of accumulation matters more than size. Rapidly developing effusions can result in tamponade physiology, even if small volume, while patients with chronically developing effusions can accommodate large volumes before tamponade physiology occurs
Sonographic Signs of Tamponade:
RA systolic collapse is earliest sign
RV diastolic collapse is diagnostic
Inflow variation: >25% for mitral valve or >40% tricuspid valve
Plethoric IVC with decreased respiratory variation
AUTHORED BY: DR. KALEE ROYSTER (PGY1)
FACULTY CO-AUTHOR/EDITOR: LAUREN MCCAFFERTY, MD
Resources
Farkas J (2021). Pericardial Tamponade. EMCrit Project. Accessed January 2022. https://emcrit.org/ibcc/tamponade/
Pérez-Casares A, Cesar S, Brunet-Garcia L, Sanchez-de-Toledo J. Echocardiographic evaluation of pericardial effusion and cardiac tamponade. Front Pediatr. 2017;5:1-10.
Reardon RF, Laudenbach A, Joing SA (2014). Cardiac. In OJ Ma, JR Mateer, RF Reardon, SA Joing (eds), Ma and Mateer’s Emergency Ultrasound (3rd ed). New York, NY: McGraw-Hill Education. pp 93-167.
Appleton C, Gillam L, Koulogiannis K. Cardiac Tamponade. Cardiol Clin. 2017;35(4):525-537
Roy CL, Minor MA, Brookhart MA, Choudhry NK. Does this patient with a pericardial effusion have cardiac tamponade? JAMA. 2007;297(16):1810-1818.
Argulian E, Messerli F. Misconceptions and facts about pericardial effusion and tamponade. Am J Med. 2013 Oct;126(10):858-61.
Mandavia DP, Hoffner JR, Mahaney K, Henderson SO. Bedside Echocardiography by emergency physicians. Ann Emerg Med. 2001;38(4):377-82.
Hanson MG, Chan B. The role of point-of-care ultrasound in the diagnosis of pericardial effusion: a single academic center retrospective study. Ultrasound J. 2021; 13(1):2.
Alerhand S, Carter JM. What echocardiographic findings suggest a pericardial effusion is causing tamponade? J Emerg Med. 2019;37(2):321-326.
Avila J. 5 Minute Sono - Pericardial Tamponade. Core Ultrasound. Accessed January 2022. www.coreultrasound.com/pericardial-tamponade/.
Avila J (2017). UOTW #78 Answer. Core Ultrasound. Accessed January 2022. www.coreultrasound.com/uotw-78-answer/.
Nagdev A, Stone MB. Point-of-Care Ultrasound Evaluation of Pericardial Effusions: Does this Patient Have Cardiac Tamponade? Resuscitation. 2011; 82(6): 671–673.
Otto, Catherine M (2013). Textbook of Clinical Echocardiography (5th ed). Philadelphia, PA: Elsevier/Saunders.
Himelman RB, Kircher B, Rockey DC, Schiller NB. Inferior vena cava plethora with blunted respiratory response: a sensitive echocardiographic sign of cardiac tamponade. J Am Coll Cardiol. 1988;12: 1470–7.